


Use Benchmark Data to Evaluate Business Purchases Like a Wall Street Pro
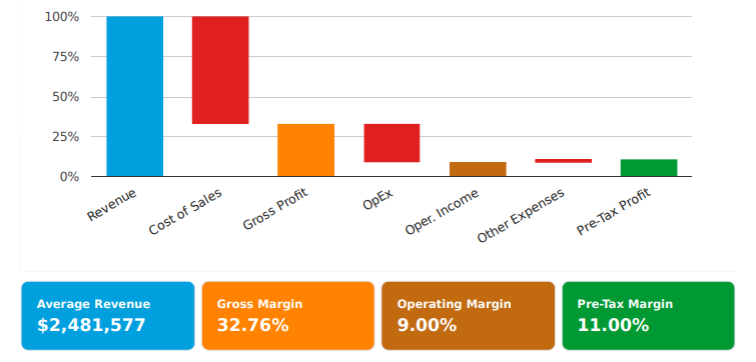

Main Street business buyers have long been flying blind on industry context when evaluating opportunities to purchase a small business. Relying primarily on the owner’s or listing broker’s word that financials are “normal” for the industry leaves buyers at a disadvantage when it comes to assessing the performance of an existing business and negotiating its value. Too often, purchase decisions are grounded in gut feelings rather than systematic analysis.
On the other end of the business acquisition spectrum, Wall Street M&A deals are rigorously scrutinized by a team of financial pros looking into years of books for any red flags and levers for negotiating final terms. This up-front work helps to prevent post-acquisition surprises and contributes to better returns on investment.
At BizBuySell, we want to empower small business buyers to approach acquisitions with the same methodical discipline. To that end, we have introduced a suite of data features for our Edge members, as well as robust Financial Benchmarks Reports available to anyone.
The Financial Benchmarks Report (FBR) gives you state-level, industry-specific metrics from operating businesses (not just listings) drawn from tax filings and other validated sources, segmented by sales class (<$1M, $1M–$5M, $5M–$25M) over five years.
How to Leverage the Financial Benchmarks Report
Analyzing potential acquisition opportunities is both an art and a science, and each deal has its own nuances. Using financial data as a guide provides buyers with a starting point for investigation. With access to detailed financial metrics in the FBR, buyers can quickly look at key income statement and balance sheet metrics to find where to dig - and which questions to ask - to uncover potential issues, creative accounting, opportunities for improvement, and structural advantages that can affect value and provide guidance for due diligence and levers for negotiation. Here are the basics on where to look, and what to look for.
1. Income Statement Benchmarks: Find the Profitability Story
The report normalizes the income statement as % of revenue across five years, with line items for Cost of Sales, Officers Compensation, Salary & Wages, Benefits, Rent, Other Expenses, Depreciation, and Pre-Tax Profit.
What to do with it
- Gross Profit vs. industry median: If your target's gross margin is materially below the benchmark, you're looking at one of three things: (a) a pricing problem, (b) a sourcing/COGS problem, or (c) creative bookkeeping. All three are negotiation levers. If it's above the benchmark, ask whether it's a real moat (proprietary product, premium clientele, powerful brand) or unsustainable (owner under-paying themselves through COGS allocation).
- Salary & Wages: If your target business’s wages are near the benchmark, it is likely properly staffed, which lowers transition risk. Well below the benchmark may indicate the owner is doing an excessive amount of employee-level work (see officers comp below). Well above may mean it’s overstaffed and there may be an efficiency upside or the owner is largely absentee.
- Officers Compensation: Small businesses structured as an LLC or sole proprietor will not report any officer’s comp. For the purposes of benchmark comparison, you may want to add in the benchmark officers comp to normalize operating expenses, overall labor expenses, and net income. For corporate targets, officers comp well above benchmark may indicate excess owner pay that should be reflected in their SDE calculation. Below benchmark may indicate a seller inflating business earnings by working excessive hours at below market pay (which may also bring down the Salary & Wages line, above).
- Rent: Especially critical if the seller owns the real estate and is charging below-market rent to the business. Compare reported rent as a percent of revenue to the benchmark; if it's well under, dig into fair-market rent levels to avoid a post-acquisition lease that will put pressure on profit margins.
- Pre-Tax Margin trend (5-year): A flat or improving margin trend is a green light. A declining margin even while revenue grows is a classic red flag of increasing competition, commoditization, or rising input costs the owner hasn't passed on to customers.
2. Balance Sheet Benchmarks: Find the Hidden Risks
Balance sheet items are normalized as % of total assets, covering Cash, Receivables, Inventory, Fixed Assets (Gross and Net), Accounts Payable, Loans/Notes Payable, Long-Term Liabilities, and Equity.
What to look for
- Inventory % above benchmark can mean potentially slow-moving or obsolete stock that you'll write down post-close. Especially relevant in retail and manufacturing, where inventory can be 25%+ of assets.
- Receivables % above benchmark can uncover collection problems, concentration in slow-paying customers, or aggressive revenue recognition.
- Cash % well below benchmark may indicate the business is undercapitalized for normal operating cycles, meaning you'll need to come up with additional working capital on Day 1.
- Loans/Notes Payable + Long-Term Liabilities above benchmark → leveraged balance sheet. In a typical asset sale you won't assume debt, but high leverage often correlates with deferred maintenance, cash strain, or interest-coverage problems that show up elsewhere in the P&L.
3. SDE, EBITDA, Revenue, Gross Profit & Pre-Tax Net Profit: Compare Business Earnings
Each of these is presented two ways: state vs. national medians, and by sales class within the state, over five years.
Practical uses
- Drop the target into the right sales class bucket and compare its SDE and EBITDA directly. If a target doing $2.4M in revenue reports $180K of SDE but the state's $1M–$5M sales class median SDE is $296K, you've identified an underperformer — which can be either an opportunity (turnaround upside) or a trap (structural cost disadvantage).
- State vs. national gaps matter for location-sensitive industries. A California car wash, jewelry store, or legal services firm operates with different rent, labor, and tax structure than the national median; using national benchmarks alone will mislead you.
- 5-year trend direction: A target outperforming on absolute SDE but trending down for three years may be in structural decline. Conversely, a target slightly below benchmark but trending up consistently is often a better buy than a peak-performance business at the top of its cycle.
4. Financial Ratios: The Red Flag Radar
The report's 15 ratios are grouped into Cash Flow & Solvency, Profitability, and Efficiency. Here's where each one earns its keep:
Cash Flow & Solvency
- Current Ratio (Current Assets ÷ Current Liabilities): Below benchmark (and especially below 1.5x) suggests short-term liquidity stress. Critical if you're using SBA financing, because post-close debt service will further tighten it.
- Quick Ratio: Same idea, but excludes inventory. A target with a healthy Current Ratio but weak Quick Ratio is leaning on inventory to look solvent, which doesn't help pay the bills and payroll.
- Days Payable: How long the business takes to pay suppliers. Significantly above benchmark could mean the seller is stretching vendors to mask cash problems, and you may inherit strained supplier relationships.
- Net Working Capital: Use this to negotiate working capital at closing. If benchmark NWC for the sales class is ~$500K and the seller is delivering $200K, you have grounds to require a true-up or a price adjustment.
Profitability
- EBITDA / Revenue %: The single cleanest comparability metric. A target running at 8% EBITDA margin against a 4% industry benchmark is a premium operator (worth a higher multiple); a target at 2% against a 4% benchmark is a fixer-upper (negotiate harder).
- Pre-Tax Return on Assets: Tests whether the asset base is being productively utilized. A low ROA with high asset levels is referred to as bloated and may have non-productive equipment that should be sold off.
Efficiency
- Fixed Asset Turnover (Revenue ÷ Net Fixed Assets): A low number vs. benchmark means equipment may be underutilized. Either there's untapped revenue potential (good) or you're buying a fleet of aging assets that need replacement capex (bad).
- Receivables Turnover: Below benchmark = slow collections. This is another area where tight cash may mean a buyer would need to come up with more working capital.
- Total Assets Turnover: Big-picture efficiency. Persistently below benchmark could mean the business model isn't getting full value from its asset base.
- Days Working Capital: How many days of revenue are tied up in NWC. Higher than benchmark = cash is trapped in the operating cycle and won't be available for debt service or owner draws.
5. Capital Intensity Analysis: Scalability vs. Barriers to Entry
Capital Intensity = Total Assets ÷ Revenue
Why this matters for buyers:
- Higher ratios = more upfront capital, more collateral for lenders, but also more ongoing maintenance expenditures and depreciation. Your "real" cash flow (SDE minus replacement capex) is materially lower than the headline number.
- Lower ratios = easier entry, better scalability, often higher valuation multiples — but also lower barriers for competitors.
- Target above the benchmark for its sales class could mean an over-invested business (opportunity to right-size) or a competitive moat (real assets that competitors can't easily replicate). The difference often determines whether you're buying value or a value trap.
Learn As You Go
For many first-time business buyers, these acronyms and jargon can feel intimidating, but it’s not rocket science, and you needn’t consider every metric. Going through the process several times is a valuable learning experience, and you will quickly become comfortable with the core principles that make an acquisition a smart move, or a risky gamble. More importantly, utilizing a systematic, data-based approach to business evaluation will make your process far more efficient, allowing you to quickly rule out the opportunities that don’t meet your criteria, and focus on the businesses that have a real shot at becoming a deal worth closing.
Know what industries or sectors you’re interested in? Find the right Benchmarks Report and start analyzing.
Need more information? Our learning center is flush with free information on the business buying process, industry specific information, and tips from brokers on the nitty gritty issues that can come up. Start learning.