Close

Already a BizBuySell Member?

Log In to Continue

Invalid log in. Check your user name and password.

Log In

Verifying...

Forgot Your Password?

Are you new to BizBuySell? Become a Free BizBuySell Member

The Wall Street Journal Online

Media Releases

  • April 4, 2012
  • BizBuySell
  • BizBuySell

Business-for-Sale Transactions Jump Nearly 4% from First Quarter of 2011 According to BizBuySell.com Insight Report

BizBuySell's Q1 data indicate most business sale transactions since fourth quarter of 2008

San Francisco, CA - April 4, 2012 -- BizBuySell.com, the Internet's largest business-for-sale marketplace, reported Wednesday that nearly four percent more businesses were sold in the first quarter of 2012 compared to the same period last year. The results were included in BizBuySell's First Quarter 2012 Insight Report.

The report, which aggregates business-for-sale transactions reported by participating business brokers nationwide, showed continued improvement in the business-for-sale market. In total, 1,729 closed transactions were reported in the first quarter of 2012, a 3.9 percent increase from Q1 2011.

2012 Q1 Closed Small Business Transactions

The 1,729 businesses that were reported sold in the first quarter of 2012 mark the largest number of transactions since the fourth quarter of 2008, making this quarter the most active in over three years. Additionally, the quarter marks the third straight period of increasing business transactions after both Q3 and Q4 of 2011 saw improving conditions.

"Seeing small business transaction totals reach 2008 levels bodes well for the upcoming months," Mike Handelsman, group general manager of BizBuySell.com and BizQuest.com said. "While we are not out of the woods yet, economic factors are slowly improving and have given the business-for-sale marketplace a nice boost to start 2012."

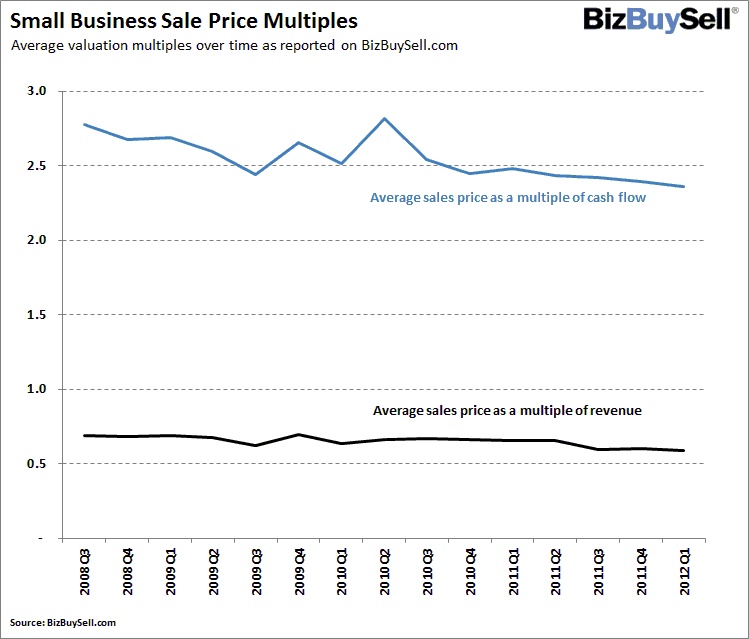
Lower Valuations Lead to Lower Prices

A main driver of the increase in transactions is that business owners were willing to accept lower prices than in previous quarters. While total closed transactions increased in Q1 of 2012, average sale price as a multiple of both revenue and cash flow decreased compared with the same period last year. The average sale price as a multiple of annual revenue fell over 10 percent to 0.59, the lowest since the financial crisis at the end of 2008. The average sale price as a multiple of cash flow decreased by 4.7 percent to 2.36.

2012 Q1 Small Business Sale Price Multiples

These falling multiples may point to business owners becoming more realistic about final sale prices. While median asking prices for sold businesses actually increased by $1,000, the median final sale price dropped 3.2 percent, from $155,000 in Q1 2011 to $150,000 in Q1 2012.

"Business owners are continuing to adjust their pricing in order to expedite a sale," Handelsman said. "While some may still be holding out for an economic recovery, many more are trying to exit at acceptable prices, even if it means settling for a lower number than they originally expected."

Better Financing Options, Unemployment Create Demand

Throughout the recession, one of the main obstacles for buyers to overcome was financing the transactions. Over the past year, credit market conditions have become more favorable. Banks are lending and more business owners are offering seller financing to prospective buyers. High unemployment rates also continue to create demand as out of work entrepreneurs seek to invest in new businesses.

"Lack of available financing is consistently named as one of the top reasons for a slow recovery by our audience of leading business brokers," Handelsman said. "As buyers find more ways to fund their business acquisitions, we expect the increase in business transactions to continue."

Continued Growth Expected for Rest of 2012

While valuation multiples dropped in Q1, median revenue for sold businesses grew from $346,000 to $360,000 compared to the same quarter last year. As these financials continue to improve, owners may finally have the confidence that their business is healthy enough to sell. Also, with many Baby Boomers reaching retirement age, the latent supply held over the past couple years could hit the market in the remainder of 2012.

2012 Q1 Key Financials for Sold Small Businesses

"There are certainly small business owners who have been biding their time since the recession hit in 2008," Handelsman said. "With better financing available for buyers and a larger supply of businesses ready to hit the market, we may finally have the right conditions for a more significant bump in the number of closed transactions.

About the BizBuySell.com Insight Report

BizBuySell.com is the Internet's largest marketplace for buying or selling a small business. The company releases its BizBuySell.com Insight Report on a quarterly basis, reporting changes in closed transaction rates, valuation multiples and other economic indicators for the small business transaction market. Closed transactions are reported to BizBuySell.com by business brokers nationwide.

About BizBuySell

BizBuySell is the Internet's largest business for sale marketplace. Since 1996, BizBuySell has offered tools that make it easy for business owners and brokers to sell a business, and potential buyers to find the business of their dreams. BizBuySell currently has an inventory of approximately 45,000 businesses - spanning 80 countries - for sale at any one time and receives more than 910,000 monthly visits. The site also features an extensive franchise directory as well as an easy-to-use business valuation tool. Please visit www.bizbuysell.com for more information.

BizBuySell was founded in 1996 and in 2012 became a division of CoStar Group, Inc. (NASDAQ - CSGP) - commercial real estate's leading provider of information and analytic services. CoStar conducts expansive, ongoing research to produce and maintain the largest and most comprehensive database of commercial real estate information and offers a suite of online services enabling clients to analyze, interpret and gain unmatched insight on commercial property values, market conditions and current availabilities. For more information, visit www.costar.com.

Media Contact:

Bobby Chilver
Walker Sands Communications
office: (312) 546-4712
email: robert.chilver@walkersands.com

APPENDIX: Additional Statistics from Small Business Transactions Reported to BizBuySell

2012 Q1 Small Business Sale Price vs. Asking Price

2012 Q1 Small Business Sales by Sector


Closed Small Business Transaction Metrics by Sector for the Full-Year 2012

Key metrics from transactions reported on BizBuySell.com by sector during 2012

BizBuySell.com
Time Period:
2012
 
Source:
BizBuySell.com
Sector Sub-Sector Number of Reported Sales Median Sales Price Median Asking Price Sales to Asking Price (average) Median Revenue Revenue Multiple (average) Median Cash Flow Cash Flow Multiple (average)
Communications Communications 10 $442,500 $525,000 0.90 $705,624 0.63 $155,710 2.30
Construction Construction-Building 10$750,000$875,7160.90$2,150,0000.45$282,4892.34
Construction-Heavy 4$1,477,500$1,775,0000.82$1,314,0001.03$402,0003.63
Construction-Special Trades 81$400,000$488,7500.89$967,6570.50$181,5002.33
Electric, Gas, Water, Sanitary Svcs Electric, Gas, Water, Sanitary Svcs 5$420,000$440,0000.95$1,288,3710.66$170,6312.76
Internet Business Services (B2B) 36$310,000$378,0000.91$474,1200.86$132,2312.29
Consumer Services (B2C) 65$250,000$275,0000.90$318,4340.80$114,3322.43
Domain Name/Basic Site 2$76,000$89,0000.85$339,6110.22$52,0001.46
General Internet 14$67,500$85,4500.88$125,2191.03$41,3242.15
Software 16$380,000$380,0000.87$480,9701.19$314,0001.88
Web Design/Tech Services 9$150,000$159,0000.90$220,0000.56$77,0001.64
Manufacturing Apparel & finished fabrics 13$250,000$250,0000.87$500,0000.60$100,8352.02
Chemicals & Allied Products 7$1,800,000$2,000,0000.98$2,437,0000.79$550,0004.87
Electronic & Electrical Equip. 16$392,000$392,0000.90$454,0000.90$120,0073.13
Fabricated Metal Products 40$512,500$574,0000.91$915,4570.70$228,2232.95
Food and Kindred Products 24$350,000$425,0000.81$600,0000.60$125,1512.82
Furniture and Fixtures 5$800,000$800,0000.96$831,6860.82$144,7853.43
Industrial & Comm. Machinery 18$732,500$1,000,0000.92$1,319,0000.61$335,0212.93
Lumber and Wood Products 17$570,000$760,0000.87$1,387,9600.74$209,7294.00
Measuring & Analyzing Instr. 7$460,000$460,0000.87$1,300,0000.56$205,5682.50
Miscellaneous 58$680,000$725,0000.94$1,000,0000.77$219,0313.21
Paper & Allied Products 7$820,000$850,0000.85$941,9110.84$150,0005.19
Petroleum Refining 2$5,750,000$6,474,5000.93$6,712,3120.88$1,304,9774.83
Primary Metal Industries 8$1,484,500$1,400,0001.10$1,421,3391.08$419,3033.51
Printing, Publishing 37$175,000$195,0000.87$323,7310.61$87,5002.20
Rubber and Plastic Products 7$292,500$442,5000.79$895,8660.83$139,0715.17
Stone, Clay, Glass, Concrete 6$522,500$562,5000.93$887,2550.54$175,2052.45
Textile Mill Products 2$190,000$225,0000.85$732,5000.29$103,0001.83
Transportation Equipment 4$1,200,000$1,225,0001.03$1,608,8200.56$381,1042.70
Mining Mining 1$2,500,000$2,500,0001.00$12,000,0000.21$3,000,0000.83
Retail Apparel and Accessory Stores 78$115,000$125,0000.91$265,0000.45$57,2642.13
Automotive Dealers 23$430,000$432,0000.85$960,2500.52$135,0002.93
Bars/Taverns 205$195,000$214,9360.91$420,0000.52$90,0002.59
Blding Mat., Hardware, Garden 29$287,500$304,5000.89$958,0070.42$150,0002.54
Convenience Stores 244$120,000$150,0000.88$460,0000.38$81,1002.20
Florists 52$76,500$97,0000.84$298,0000.34$64,1161.55
Gasoline Service Stations 180$303,000$375,0000.87$1,160,0000.52$150,0003.06
General Merchandise Stores 43$102,500$120,0000.88$466,7500.32$77,0692.03
Home Furniture & Furnishings 32$141,000$144,0000.96$380,0000.49$84,7782.14
Liquor Stores 219$250,000$275,0000.89$673,1690.44$106,0002.90
Marine Dealers & Equipment 6$235,000$299,0000.91$1,010,7550.38$118,8001.72
Miscellaneous Retail 226$149,000$167,6000.91$315,0000.53$77,6842.23
Other Eating & Drinking Places 186$110,000$125,0000.86$301,0000.44$61,0392.17
Other Food Stores 63$135,000$164,5000.89$393,0220.44$80,1692.12
Pet Shops & Supplies 27$132,500$167,0000.83$347,2550.45$78,4761.88
Restaurants 1,107$125,000$145,0000.88$375,0000.39$75,0002.04
Supermarkets 32$324,500$361,6960.88$1,350,0000.28$165,6202.19
Vending Machines 68$110,000$120,0000.89$118,3600.95$55,0002.30
Service Agents & Brokers 41$200,000$299,0000.91$214,0381.30$90,7952.70
Amusement & Recreation 66$175,000$189,5000.89$309,6050.79$102,2222.21
Auto Repair, Parts & Services 257$235,000$278,2330.91$560,0000.71$133,6242.57
Beauty Salons, Barber Shops 183$93,000$100,0000.87$194,0000.53$52,0001.96
Computer & Software Services 30$377,500$442,5000.90$518,2870.83$177,7242.72
Drycleaning/Laundry Services 300$150,000$175,0000.88$185,6050.96$65,0002.77
Educational Services 119$202,500$239,9500.86$319,8790.75$100,0002.44
Engineering & Accounting Svcs 41$211,000$236,0000.90$195,3400.96$97,7792.09
Finance, Banking, Loans, etc. 23$400,000$412,5000.88$383,2110.93$150,0002.52
Freight, Moving/Delivery 65$190,000$237,0000.90$330,0000.70$110,0002.35
Health, Medical & Dental 214$227,500$295,0000.88$504,0000.64$125,0002.17
Hotels & Other Lodging Places 51$265,000$325,0000.90$325,0501.23$103,4623.62
Landscaping & Yard Services 149$122,500$149,5000.91$263,5000.65$89,2491.88
Legal Services 11$250,000$275,0000.88$384,8751.07$105,5002.66
Marine Repair, Parts & Services 9$250,000$299,0000.86$308,6000.87$83,0003.51
Membership Organizations 6$230,000$299,0000.84$275,0000.76$95,0002.01
Miscellaneous Repair Services 67$285,000$250,0000.91$590,0000.60$159,6272.05
Miscellaneous Services 252$120,000$145,0000.91$187,8000.74$84,0001.82
Motion Pictures 2$2,000,000$2,500,0000.80$2,000,0001.00$675,0002.96
Museums, Art Galleries, Zoos 3$199,990$199,9900.91$266,3120.85$125,0003.07
Other Business Services 194$200,000$249,0000.86$385,0000.62$105,0002.25
Other Personal Services 154$75,300$91,5010.93$153,9940.65$66,5001.43
Other Travel & Transportation 18$232,500$245,0000.93$417,8150.77$107,4392.58
Passenger Transportation 14$275,000$350,0000.84$459,7000.62$112,7002.44
Pet Care & Grooming 34$124,500$139,0000.85$209,5200.76$60,0002.36
Social Services 6$500,000$555,0000.85$446,4740.92$120,0003.50
Storage & Warehousing 9$500,000$400,0000.90$1,004,8330.62$181,3002.98
Travel Agencies 3$81,750$85,5000.95$209,0000.39$58,3001.52
Wholesale Durable Goods 77$285,000$325,0000.87$634,0420.59$137,7552.53
Nondurable Goods 85$142,500$145,0000.92$281,6010.71$72,7852.12

Source: Small business transactions reported on BizBuySell.com during 2012

^ Return to top of Insights Data Summary

Closed Small Business Transaction Metrics by Geographic Market for the Full-Year 2012

Key metrics from transactions reported on BizBuySell.com by market during 2012

BizBuySell.com
Time Period:
2012
 
Source:
BizBuySell.com
Market # of Reported Sales Median Asking Price Median Sale Price Sales to Asking Price (average) Median Revenue Median Cash Flow Revenue Multiple (average) Cash Flow Multiple (average)
Albany-Schenectady-Troy, NY7$250,000$220,0000.90$337,000$90,0000.572.21
Albuquerque, NM4$124,000$115,0000.84$305,000$74,0000.432.07
Atlanta-Sandy Springs-Marietta, GA142$192,000$165,0000.89$385,000$100,0000.662.54
Austin-Round Rock, TX48$184,000$165,8000.89$293,500$90,0000.672.38
Baltimore-Towson, MD36$185,000$140,0000.81$372,036$65,0000.612.73
Birmingham-Hoover, AL8$250,000$280,0001.18$604,000$110,2050.562.78
Boston-Cambridge-Quincy, MA-NH150$192,500$170,0000.88$444,237$99,8750.501.99
Bridgeport-Stamford-Norwalk, CT30$175,000$175,0000.88$480,000$101,0000.502.07
Buffalo-Niagara Falls, NY3$1,300,000$1,250,0000.92$1,200,000$330,0001.224.35
Charlotte-Gastonia-Concord, NC-SC36$370,000$275,0000.89$484,000$154,7970.632.74
Chicago-Naperville-Joliet, IL-IN-WI149$181,500$154,5000.89$392,390$80,6740.492.19
Cincinnati-Middletown, OH-KY-IN8$95,000$95,0000.88$298,055$69,2360.512.84
Cleveland-Elyria-Mentor, OH33$180,000$150,0000.89$419,000$83,5000.462.68
Columbus, OH25$119,900$87,0000.92$289,884$52,2580.422.17
Contra Costa-Alameda-Solano, CA18$410,000$410,0000.92$500,000$194,2490.812.18
Dallas-Fort Worth-Arlington, TX176$125,000$115,0000.91$318,600$77,8420.562.43
Dayton, OH4$157,500$143,7500.85$245,402$59,0721.242.64
Denver-Aurora, CO102$180,000$165,0000.88$345,728$80,0000.552.35
Detroit-Warren-Livonia, MI54$122,500$85,0000.80$239,805$60,0000.462.33
Durham, NC15$165,000$160,0000.93$380,000$75,0000.512.26
Fresno, CA4$212,000$189,5000.87$790,000$114,5000.492.61
Greensboro-High Point, NC16$350,000$300,0000.87$728,412$150,0000.602.56
Hartford-West Hartford-East Hartford, CT30$149,000$122,5000.87$342,505$83,3800.501.76
Honolulu, HI2$105,500$87,5000.82$264,266$33,7110.342.61
Houston-Sugar Land-Baytown, TX131$150,000$140,0000.91$243,552$80,6940.621.84
Indianapolis-Carmel, IN41$177,500$170,0000.90$416,000$60,8100.512.67
Jacksonville, FL27$137,500$127,5000.84$278,560$104,8720.712.30
Kansas City, MO-KS31$300,000$285,0000.92$514,000$127,0000.612.26
Las Vegas-Paradise, NV37$136,300$117,5001.03$277,718$83,2540.572.19
Los Angeles-Long Beach-Santa Ana, CA414$179,000$150,0000.89$299,000$80,3280.602.24
Louisville-Jefferson County, KY-IN22$253,350$177,0000.87$488,128$80,5000.572.30
Memphis, TN-MS-AR19$85,000$80,0000.90$271,030$43,4430.482.63
Miami-Fort Lauderdale-Miami Beach, FL264$170,000$139,5000.89$300,000$84,5000.632.05
Milwaukee-Waukesha-West Allis, WI22$289,000$289,0000.88$370,000$100,0000.713.43
Minneapolis-St. Paul-Bloomington, MN-WI55$175,000$159,0000.92$312,165$79,2380.622.65
Nashville-Davidson--Murfreesboro, TN51$129,000$100,0000.83$310,000$60,0000.652.26
New Haven-Milford, CT32$137,000$117,5000.87$410,000$86,0000.371.59
New Jersey318$200,000$192,5000.91$353,000$97,0720.732.53
New Orleans-Metairie-Kenner, LA1$250,000$250,0001.00$431,256$132,3120.581.89
New York-Northern New Jersey-Long Island, NY-NJ-PA586$250,000$219,0000.90$420,000$110,0000.712.38
Oklahoma City, OK10$412,500$387,5000.88$596,559$144,0000.622.92
Orange County, CA166$195,000$155,0000.92$280,000$78,4160.632.29
Orlando-Kissimmee, FL172$140,000$120,0000.88$261,015$74,5250.551.99
Philadelphia-Camden-Wilmington, PA-NJ-DE-MD142$285,000$229,0000.91$425,000$120,0000.682.37
Phoenix-Mesa-Scottsdale, AZ176$149,000$125,0000.88$285,000$85,5000.611.82
Pittsburgh, PA31$315,000$315,0000.88$489,482$124,0000.582.36
Portland-Vancouver-Beaverton, OR-WA67$170,000$150,0000.91$336,713$77,1620.502.31
Providence-New Bedford-Fall River, RI-MA29$200,000$200,0000.91$562,000$107,0000.522.68
Raleigh-Cary, NC31$170,000$150,0000.85$400,491$80,0000.632.56
Richmond, VA13$100,000$85,0000.82$194,000$50,0000.611.79
Riverside-San Bernardino-Ontario, CA81$149,995$125,0000.89$352,120$81,6560.531.87
Rochester, NY3$1,200,000$1,087,0001.05$1,439,240$322,3710.763.00
Sacramento--Arden-Arcade--Roseville, CA29$125,000$115,0000.82$278,678$57,0000.582.04
Salt Lake City, UT27$445,000$416,0000.88$628,498$149,1200.742.91
San Antonio, TX42$175,000$147,5000.89$336,500$85,0000.722.42
San Diego-Carlsbad-San Marcos, CA68$135,000$120,0000.88$282,151$71,1000.471.81
San Francisco-Oakland-Fremont, CA42$410,000$375,0000.94$660,000$169,7640.752.48
San Jose-Sunnyvale-Santa Clara, CA22$159,000$150,0000.87$365,000$60,0000.492.12
Seattle-Tacoma-Bellevue, WA67$155,000$125,0000.90$449,052$89,6470.462.18
St. Louis, MO-IL25$424,500$337,5000.88$742,219$213,9200.713.05
Tampa-St. Petersburg-Clearwater, FL197$132,000$120,0000.87$286,423$74,1080.522.12
Tucson, AZ19$140,000$130,0000.94$282,500$99,0000.582.01
Tulsa, OK8$294,500$212,5000.76$388,129$99,7900.602.56
Virginia Beach-Norfolk-Newport News, VA-NC37$169,900$127,0000.82$425,000$100,0000.451.97
Washington-Arlington-Alexandria, DC-VA-MD-WV130$200,000$190,0000.88$515,000$100,4200.462.21
Wichita, KS7$180,000$162,5000.87$336,100$64,7950.552.21
Winston-Salem, NC7$425,000$334,0000.91$600,878$87,4720.452.47

Source: Small business transactions reported on BizBuySell.com during 2012

^ Return to top of Insights Data Summary


Return to Media Releases

Members of the Media
  • Let us serve as expert sources for you on buying a business, selling a business, valuing a business and small business trends. Email us here or call Curtis Kroeker at 415-284-4380

BizBuySell is the Internet's largest and most heavily trafficked business for sale marketplace, with more business for sale listings, more unique users, and more search activity than any other service.