Close

Already a BizBuySell Member?

Log In to Continue

Invalid log in. Check your user name and password.

Log In

Verifying...

Forgot Your Password?

Are you new to BizBuySell? Become a Free BizBuySell Member

The Wall Street Journal Online

Media Releases

  • January 4, 2012
  • BizBuySell
  • BizBuySell

BizBuySell.com Reports Increasing Business-For-Sale Transactions, Lower Valuations in 2011

BizBuySell's annual year-end report finds more small businesses were sold in 2011 than in 2010, spurred by slightly decreased valuations, improved business performance, and slow improvement in capital access.
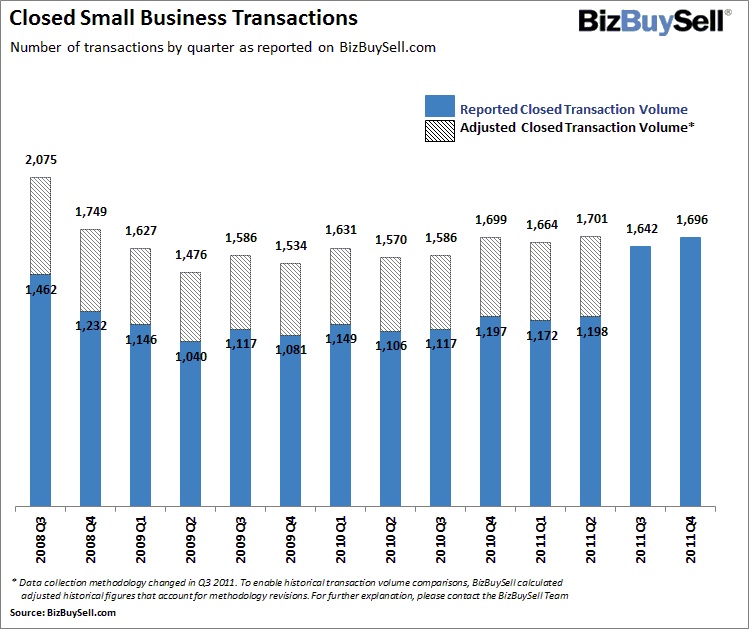
San Francisco, CA - January 4, 2012 -- BizBuySell.com, the Internet's largest marketplace for buying or selling a small business, today released its Full-Year and Fourth Quarter 2011 Insight Report on business succession trends. The report, which aggregates business for sale transaction data provided by participating business brokers, shows that small business sales were up slightly in 2011. This continues a trend of gradual year-over-year growth that began at the beginning of 2009.

For 2011, the number of small businesses reported as sold to BizBuySell.com across the U.S. was 6,703, an increase of 3.3 percent over the 2010 total of 6,486.* This follows a similar 3.0 percent jump in closed transactions from 2009 to 2010 (see following graph for quarter-by-quarter sales).

2011 Q3 Closed Small Business Transactions

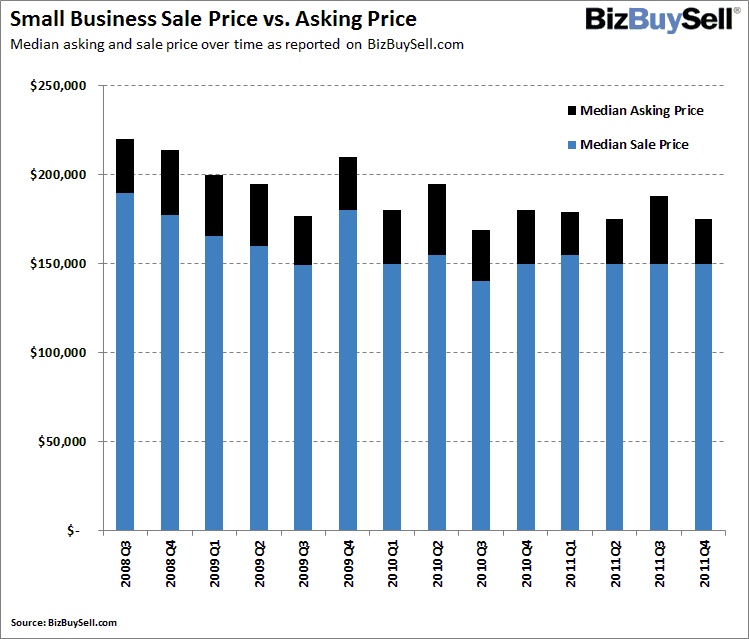
The slight rise in closed transactions was accompanied by an equivalent 3.3 percent increase in the median selling price, from $150,000 in 2010 to $155,000 in 2011. However, median revenue for sold businesses was up more (6.7 percent) indicating that improved business performance contributed to increased sales activity. This also shows that business owners are adjusting their pricing expectations and selling their businesses for less relative to revenue and cash flow to get deals done.

"While 2011 continued to be a tough year for the nation's small business owners, we were pleased to see that business performance is improving and more people are buying small businesses," Mike Handelsman, group general manager of BizBuySell.com and BizQuest.com said. "Helping this is the fact that business sellers are adjusting their value expectations, something that should continue to spur deals in 2012."

Buyers Getting More for their Money

Transactions reported to BizBuySell.com showed that buyers are getting more for their money and that favorable market conditions continue to exist for buyers who have or can secure necessary funding. The average revenue multiple for small businesses sold in 2011 was .60, down 8.8 percent vs. 2010 and the average cash flow multiple was 2.36, down 8.2 percent (see following graph for average valuation multiples by quarter).

2011 Q3 Small Business Sale Price Multiples

Fourth Quarter of 2011 in Line with Annual Trends

The final quarter of 2011 showed similar results to the full year. Closed transactions were basically unchanged, from 1,699 in Q4 2010 to 1,696 in Q4 2011. This is encouraging, as the fourth quarter of 2010 saw increased selling activity due to the expected end of the reduced capital gains tax rates that were set to expire at the end of 2010 (note: late in Q4 2010, the reduced tax rates were extended until the end of 2012). In Q4 2011, businesses sold for a multiple of revenue of .60, down 8.6 percent vs. Q4 2010, while the multiple of cash flow was 2.39, down 2.3 percent. Meanwhile, the median asking price in Q4 2011 for small businesses sold dropped $5,000 year-over-year to $175,000 (see following graph for median asking and selling prices by quarter).

2011 Q3 Small Business Sale Price vs. Asking Price

"We are seeing improved small business transaction activity driven, at least in part, by the fact that small business owners are lowering prices to attract buyers," says Handelsman. "It's slowly becoming a better time to be a seller, but it's already a good time to be a buyer."

Continued Gradual Growth Expected

Fundamentals point to a continued slow, but-steady, growth in the business-for-sale market in 2012 barring unforeseen global economic issues. Small business performance is improving and sellers who haven't been able to sell for the past few years should start to reach performance levels that make a sale possible. Added to this is the fact that sellers are becoming increasingly realistic about valuations to more aggressively seek a sale. Finally, underlying all of this is the very favorable long-term conditions of latent supply (e.g., the large number of U.S. baby boomers reaching retirement age) and demand that will continue to fuel transaction growth, especially as credit restrictions ease.

"The Federal Government and Small Business Association are continuing to focus on helping ease bank lending restrictions and providing more capital to the small business market," Handelsman said. "As more buyers and sellers begin to take advantage of these initiatives, we expect the gradual increase in business transactions to continue in 2012."

* Note: Data collection methodology changed in Q3 2011. To enable historical transaction volume comparisons, BizBuySell calculated adjusted historical figures that account for methodology revisions. For further explanation, please contact the media contact listed below.

Media Contact:

Will Kruisbrink
Walker Sands Communications
office: (312) 651-4024
email: will.kruisbrink@walkersands.com

APPENDIX: Additional Sales Statistics - National, by Sector, and by Geographic Market

2011 Q3 Key Financials for Sold Small Businesses

2011 Q3 Small Business Sales by Sector

Members of the Media
  • Let us serve as expert sources for you on buying a business, selling a business, valuing a business and small business trends. Email us here or call Curtis Kroeker at 415-284-4380

BizBuySell is the Internet's largest and most heavily trafficked business for sale marketplace, with more business for sale listings, more unique users, and more search activity than any other service.

Closed Small Business Transaction Metrics by Sector for 2011

Key metrics from transactions reported on BizBuySell.com

BizBuySell.com
Time Period:
2011
 
Source:
BizBuySell.com
Sector Sub-Sector Number of Reported Sales Median Sales Price Median Asking Price Sales to Asking Price (average) Median Revenue Revenue Multiple (average) Median Cash Flow Cash Flow Multiple (average)
Agriculture Agriculture 6 $1,887,500 $1,875,000 1.04 $5,522,984 0.47 $456,000 4.00
Communications Communications 13 $700,000 $700,000 0.85 $1,100,000 0.69 $480,000 2.10
Construction Construction-Building 18 $540,000 $635,000 0.93 $2,066,108 0.38 $330,120 2.60
Construction-Heavy 2 $741,500 $747,500 0.99 $632,500 1.16 $164,000 4.47
Construction-Special Trades 63 $450,000 $500,000 0.88 $992,873 0.55 $209,799 2.35
Electric, Gas, Water, Sanitary Svcs Electric, Gas, Water, Sanitary Svcs 4 $550,000 $612,500 0.92 $676,633 1.27 $221,229 2.58
Internet Business Services (B2B) 24 $267,500 $275,000 0.94 $345,130 0.97 $130,000 2.43
Consumer Services (B2C) 53 $130,000 $149,000 0.89 $199,989 0.79 $67,055 2.13
Domain Name/Basic Site 1 N/A N/A N/A N/A N/A N/A N/A
General Internet 19 $139,000 $145,000 0.88 $210,476 1.01 $62,224 2.44
ISP/ASP Services 2 $437,500 $500,000 0.89 $304,891 1.44 $242,500 1.86
Software 6 $1,275,000 $1,600,000 0.85 $785,284 0.93 $502,281 2.35
Web Design/Tech Services 4 $233,750 $271,250 0.90 $754,040 0.64 $181,903 1.86
Manufacturing Apparel & finished fabrics 7 $295,000 $339,500 0.90 $782,113 0.43 $121,451 2.40
Chemicals & Allied Products 8 $502,500 $502,500 0.93 $1,633,000 0.69 $200,000 3.48
Electronic & Electrical Equip. 10 $1,322,500 $1,425,000 0.94 $1,487,566 0.73 $384,197 3.49
Fabricated Metal Products 53 $600,000 $750,000 0.91 $1,000,000 0.76 $212,756 3.18
Food and Kindred Products 32 $445,000 $512,500 0.90 $849,773 0.64 $149,625 2.87
Furniture and Fixtures 8 $362,500 $380,000 0.88 $695,814 0.43 $172,467 2.62
Industrial & Comm. Machinery 13 $825,000 $1,300,000 0.92 $1,444,000 0.51 $384,893 2.93
Leather and Leather Products 1 $1,500,000 $1,500,000 1.00 $15,000,000 0.10 $1,000,000 1.50
Lumber and Wood Products 17 $362,500 $364,000 0.90 $610,000 0.67 $100,000 3.48
Measuring & Analyzing Instr. 2 $2,000,000 $2,000,000 1.00 $1,200,000 1.67 $624,000 3.21
Miscellaneous 54 $475,000 $585,000 0.90 $959,216 0.72 $164,502 3.17
Paper & Allied Products 2 $2,700,000 $2,712,500 0.97 $30,300,988 0.37 $1,075,000 2.58
Petroleum Refining 2 $378,500 $397,500 0.90 $329,131 1.12 $211,527 1.66
Primary Metal Industries 6 $450,000 $650,000 0.87 $777,624 0.61 $230,000 2.69
Printing, Publishing 45 $300,000 $337,500 0.89 $492,982 0.51 $106,973 2.25
Rubber and Plastic Products 13 $715,500 $995,000 0.88 $1,302,328 1.17 $346,429 3.25
Stone, Clay, Glass, Concrete 12 $145,000 $375,000 0.77 $619,699 0.64 $100,000 2.74
Textile Mill Products 1 $1,200,000 $1,200,000 1.00 $2,400,000 0.50 $500,000 2.40
Tobacco Products 1 $446,193 $435,000 1.03 $572,560 0.78 $220,809 2.02
Transportation Equipment 2 $1,275,000 $1,925,000 0.67 $3,900,000 0.33 $775,000 1.91
Mining Mining 10 $1,278,500 $1,297,500 0.90 $1,073,000 1.14 $556,814 1.89
Retail Apparel and Accessory Stores 67 $110,000 $125,000 0.87 $262,147 0.50 $48,000 2.34
Automotive Dealers 29 $345,000 $372,000 0.84 $1,100,000 0.43 $155,000 2.62
Bars/Taverns 267 $177,000 $199,000 0.87 $438,000 0.53 $83,250 2.53
Blding Mat., Hardware, Garden 38 $300,000 $322,500 0.92 $546,272 0.61 $102,995 3.08
Convenience Stores 230 $150,000 $179,500 0.86 $550,000 0.39 $100,000 2.27
Florists 48 $88,731 $102,000 0.91 $270,000 0.47 $60,000 2.24
Gasoline Service Stations 225 $400,000 $465,000 0.86 $1,555,081 0.47 $144,000 3.34
General Merchandise Stores 32 $90,000 $120,000 0.83 $360,000 0.43 $55,503 2.05
Home Furniture & Furnishings 28 $175,000 $187,500 0.89 $600,295 0.35 $100,000 2.17
Liquor Stores 262 $250,750 $279,500 0.87 $725,500 0.42 $107,383 2.79
Marine Dealers & Equipment 6 $250,000 $250,000 0.94 $885,000 0.45 $115,000 1.95
Miscellaneous Retail 232 $125,000 $149,000 0.87 $340,000 0.52 $70,000 2.43
Other Eating & Drinking Places 201 $116,500 $125,000 0.88 $310,407 0.48 $66,375 2.39
Other Food Stores 99 $160,000 $197,000 0.85 $417,500 0.42 $96,000 2.16
Pet Shops & Supplies 19 $156,000 $175,000 0.91 $364,807 0.38 $60,838 2.32
Restaurants 1298 $125,000 $149,000 0.87 $390,500 0.40 $71,570 2.16
Supermarkets 35 $350,000 $450,000 0.81 $1,700,000 0.37 $180,000 2.21
Vending Machines 55 $120,000 $129,000 0.88 $130,268 1.00 $54,899 2.22
Service Agents & Brokers 31 $175,000 $204,000 0.89 $189,037 1.32 $90,206 2.74
Amusement & Recreation 75 $150,000 $175,000 0.86 $300,000 0.66 $90,000 2.37
Auto Repair, Parts & Services 217 $250,000 $280,000 0.88 $588,000 0.69 $115,000 2.70
Beauty Salons, Barber Shops 190 $75,000 $95,000 0.87 $215,000 0.45 $50,191 1.82
Computer & Software Services 37 $225,000 $299,000 0.83 $400,000 0.91 $143,000 2.07
Drycleaning/Laundry Services 332 $149,500 $172,500 0.88 $180,000 0.92 $66,408 2.74
Educational Services 117 $200,000 $225,000 0.87 $370,000 0.76 $103,318 2.45
Engineering & Accounting Svcs 153 $200,000 $205,000 0.91 $185,000 1.02 $100,000 2.22
Finance, Banking, Loans, etc. 27 $125,000 $125,975 0.83 $158,910 0.70 $62,798 2.24
Freight, Moving/Delivery 63 $154,000 $175,000 0.89 $217,306 0.76 $86,700 1.99
Health, Medical & Dental 197 $305,000 $317,500 0.89 $470,139 0.73 $127,833 2.76
Hotels & Other Lodging Places 48 $400,000 $481,000 0.84 $250,000 1.44 $94,923 3.84
Landscaping & Yard Services 105 $120,000 $145,000 0.90 $200,000 0.70 $84,003 1.76
Legal Services 5 $418,500 $472,500 0.82 $738,500 0.59 $153,698 1.95
Marine Repair, Parts & Services 7 $290,000 $395,000 0.90 $1,032,600 0.65 $180,000 3.43
Membership Organizations 1 $799,000 $799,000 1.00 $1,501,000 0.53 $200,000 4.00
Miscellaneous Repair Services 36 $250,000 $294,000 0.86 $452,130 0.62 $142,000 2.01
Miscellaneous Services 178 $139,200 $150,000 0.90 $239,397 0.69 $85,400 1.89
Motion Pictures 5 $1,663,000 $1,687,500 0.80 $770,103 1.69 $242,635 4.60
Museums, Art Galleries, Zoos 1 $105,000 $175,000 0.60 $307,552 0.34 $80,862 1.30
Other Business Services 246 $202,500 $225,000 0.89 $381,581 0.62 $103,683 2.41
Other Personal Services 227 $80,000 $82,320 0.94 $112,536 0.66 $69,058 1.58
Other Travel & Transportation 20 $287,500 $300,000 0.91 $559,022 0.78 $131,160 2.27
Passenger Transportation 10 $180,000 $212,500 0.89 $312,500 0.83 $145,966 2.04
Pet Care & Grooming 38 $215,000 $260,000 0.88 $283,758 1.06 $78,898 3.03
Social Services 9 $137,500 $142,500 0.87 $380,879 0.59 $68,553 2.22
Storage & Warehousing 9 $294,000 $450,000 0.93 $321,380 1.63 $117,193 4.21
Travel Agencies 6 $87,000 $92,000 0.94 $249,911 0.46 $60,175 1.94
Wholesale Durable Goods 69 $350,000 $450,000 0.88 $963,708 0.55 $176,000 2.63
Nondurable Goods 120 $142,000 $150,000 0.91 $347,139 0.70 $80,044 2.14

Source: Small business transactions reported on BizBuySell.com during 2011

^ Return to top of Insights Data Summary

Closed Small Business Transaction Metrics by Geographic Market for 2011

Key metrics from transactions reported on BizBuySell.com

BizBuySell.com
Time Period:
2011
 
Source:
BizBuySell.com
Market # of Reported Sales Median Asking Price Median Sale Price Sales to Asking Price (average) Median Revenue Median Cash Flow Revenue Multiple (average) Cash Flow Multiple (average)
Albany-Schenectady-Troy, NY 12 $229,000 $175,000 0.91 $600,000 $131,329 0.54 2.51
Albuquerque, NM 8 $315,000 $300,000 0.94 $596,174 $95,000 0.61 3.09
Atlanta-Sandy Springs-Marietta, GA 165 $150,000 $130,000 0.89 $367,000 $78,276 0.59 2.52
Austin-Round Rock, TX 54 $191,000 $160,000 0.87 $377,091 $91,529 0.59 2.08
Baltimore-Towson, MD 58 $284,450 $237,500 0.88 $497,500 $110,000 0.62 2.40
Birmingham-Hoover, AL 7 $115,000 $100,000 0.77 $265,000 $50,000 0.49 2.00
Boston-Cambridge-Quincy, MA-NH 128 $216,500 $199,000 0.89 $500,000 $108,000 0.50 2.35
Bridgeport-Stamford-Norwalk, CT 35 $177,500 $160,000 0.87 $300,000 $100,000 0.57 1.98
Buffalo-Niagara Falls, NY 0 N/A N/A N/A N/A N/A N/A N/A
Charlotte-Gastonia-Concord, NC-SC 43 $350,000 $310,000 0.89 $650,000 $118,000 0.69 2.20
Chicago-Naperville-Joliet, IL-IN-WI 122 $150,000 $140,000 0.88 $350,000 $70,000 0.54 2.29
Cincinnati-Middletown, OH-KY-IN 19 $212,000 $170,000 0.84 $298,731 $75,000 0.59 2.95
Cleveland-Elyria-Mentor, OH 34 $240,000 $200,000 0.86 $407,689 $60,000 0.47 2.71
Columbus, OH 39 $119,900 $110,000 0.86 $259,269 $54,000 0.43 2.42
Contra Costa-Alameda-Solano, CA 40 $225,000 $178,500 1.09 $336,150 $106,056 0.65 2.07
Dallas-Fort Worth-Arlington, TX 183 $235,000 $200,000 0.89 $440,580 $100,000 0.76 2.84
Dayton, OH 6 $75,000 $72,500 0.92 $504,000 $51,000 0.42 2.43
Denver-Aurora, CO 69 $179,500 $166,315 0.91 $395,000 $71,507 0.59 2.57
Detroit-Warren-Livonia, MI 61 $149,000 $110,000 0.84 $301,131 $62,500 0.60 2.46
Durham, NC 9 $325,000 $192,500 0.76 $424,721 $100,000 0.51 2.35
Fresno, CA 8 $300,000 $180,000 0.81 $406,992 $70,000 0.88 2.29
Greensboro-High Point, NC 8 $210,000 $190,000 0.89 $466,000 $101,500 0.48 1.72
Hartford-West Hartford-East Hartford, CT 26 $139,500 $100,000 0.85 $340,420 $60,000 0.54 1.92
Honolulu, HI 6 $155,000 $130,000 0.93 $187,246 $65,000 0.84 1.67
Houston-Sugar Land-Baytown, TX 144 $150,000 $128,000 0.91 $294,791 $75,000 0.59 2.02
Indianapolis-Carmel, IN 35 $180,000 $132,500 0.84 $400,000 $64,051 0.55 2.67
Jacksonville, FL 44 $122,500 $115,000 0.87 $313,892 $75,569 0.57 2.06
Kansas City, MO-KS 32 $198,000 $153,750 0.88 $245,000 $85,000 0.71 2.49
Las Vegas-Paradise, NV 41 $99,525 $89,500 0.91 $298,902 $65,000 0.39 1.61
Los Angeles-Long Beach-Santa Ana, CA 389 $175,000 $150,000 0.87 $350,000 $81,000 0.58 2.36
Louisville-Jefferson County, KY-IN 23 $159,000 $137,500 0.89 $245,000 $65,500 0.55 3.25
Memphis, TN-MS-AR 14 $135,000 $125,000 0.89 $400,000 $75,000 0.37 2.48
Miami-Fort Lauderdale-Miami Beach, FL 249 $184,500 $161,500 0.87 $368,616 $98,289 0.57 1.91
Milwaukee-Waukesha-West Allis, WI 17 $160,000 $157,530 0.92 $316,381 $46,220 0.70 2.41
Minneapolis-St. Paul-Bloomington, MN-WI 66 $172,500 $127,500 0.92 $306,739 $72,942 0.59 2.70
Nashville-Davidson--Murfreesboro, TN 65 $149,500 $115,000 0.83 $248,500 $60,013 0.62 2.18
New Haven-Milford, CT 25 $175,000 $140,000 0.84 $450,000 $73,767 0.47 2.01
New Jersey 264 $200,000 $189,000 0.88 $360,000 $100,000 0.68 2.35
New Orleans-Metairie-Kenner, LA 3 $195,000 $180,000 0.92 $195,000 $110,000 0.92 1.64
New York-Northern New Jersey-Long Island, NY-NJ-PA 568 $225,000 $200,000 0.87 $435,500 $107,232 0.62 2.24
Oklahoma City, OK 15 $141,750 $92,500 0.85 $216,000 $82,500 0.63 2.10
Orange County, CA 161 $147,000 $117,000 0.88 $300,000 $72,000 0.58 2.28
Orlando-Kissimmee, FL 153 $147,000 $125,000 0.85 $302,676 $80,343 0.55 1.84
Philadelphia-Camden-Wilmington, PA-NJ-DE-MD 157 $195,000 $160,000 0.88 $365,000 $100,000 0.59 2.30
Phoenix-Mesa-Scottsdale, AZ 168 $137,100 $120,000 0.88 $247,155 $63,056 0.62 2.10
Pittsburgh, PA 34 $320,000 $287,000 0.84 $761,000 $143,336 0.44 2.24
Portland-Vancouver-Beaverton, OR-WA 59 $170,000 $170,000 0.90 $385,000 $68,739 0.46 2.82
Providence-New Bedford-Fall River, RI-MA 18 $300,000 $300,000 0.94 $470,000 $103,064 0.58 2.68
Raleigh-Cary, NC 35 $250,000 $225,000 0.94 $550,000 $110,115 0.60 2.45
Richmond, VA 21 $117,500 $104,500 0.87 $166,250 $82,500 0.54 1.95
Riverside-San Bernardino-Ontario, CA 76 $249,500 $235,000 0.87 $499,448 $109,500 0.55 2.15
Rochester, NY 0 N/A N/A N/A N/A N/A N/A N/A
Sacramento--Arden-Arcade--Roseville, CA 30 $149,500 $134,500 0.91 $299,000 $67,061 0.69 2.62
Salt Lake City, UT 28 $350,000 $350,000 0.95 $236,113 $120,474 1.06 3.15
San Antonio, TX 53 $160,000 $137,500 0.92 $213,000 $92,500 0.71 2.46
San Diego-Carlsbad-San Marcos, CA 74 $169,000 $150,000 0.87 $378,162 $85,000 0.53 1.94
San Francisco-Oakland-Fremont, CA 67 $250,000 $182,000 0.95 $400,000 $98,034 0.61 2.35
San Jose-Sunnyvale-Santa Clara, CA 30 $220,000 $160,000 0.88 $600,000 $90,000 0.54 2.61
Seattle-Tacoma-Bellevue, WA 99 $199,000 $175,000 0.87 $481,116 $85,000 0.48 2.52
St. Louis, MO-IL 15 $174,600 $154,500 0.77 $246,366 $55,137 0.76 3.19
Tampa-St. Petersburg-Clearwater, FL 243 $149,000 $130,000 0.90 $350,000 $75,000 0.55 2.18
Tucson, AZ 25 $154,500 $149,500 0.89 $258,112 $81,602 0.60 2.43
Tulsa, OK 4 $109,944 $104,944 0.86 $129,201 $39,526 0.95 2.43
Virginia Beach-Norfolk-Newport News, VA-NC 37 $195,000 $152,000 0.83 $428,050 $79,916 0.70 2.33
Washington-Arlington-Alexandria, DC-VA-MD-WV 227 $199,000 $170,000 0.86 $450,000 $90,000 0.50 2.49
Wichita, KS 13 $234,850 $202,250 0.87 $441,000 $74,500 0.45 2.76
Winston-Salem, NC 4 $905,000 $775,000 0.92 $1,706,592 $334,794 0.43 2.64

Source: Small business transactions reported on BizBuySell.com during 2011

^ Return to top of Insights Data Summary